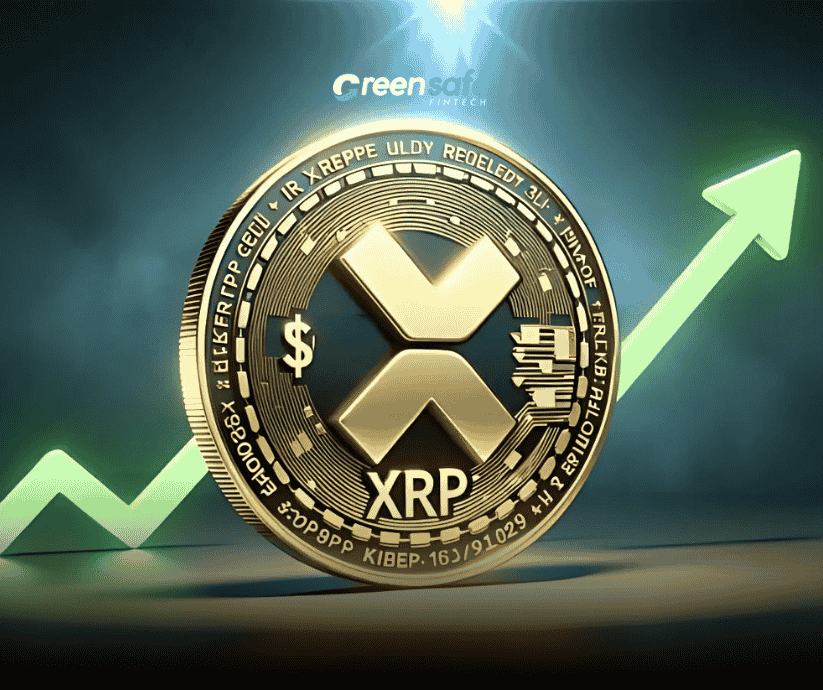
XRP has been on a bullish streak, recording a notable 15% increase and outperforming major cryptocurrencies like Bitcoin and Ethereum. The price recently surged past the $0.740 resistance and currently holds firm above the $0.750 level, trading above the 100-hourly Simple Moving Average.
XRP Price Analysis and Key Resistance Levels
XRP began its upward momentum after forming a base near $0.620. The rally gained strength as the price breached the $0.7000 and $0.740 resistance levels, climbing to a high of $0.8989 before encountering selling pressure.
Following a brief retracement to $0.720, the price rebounded and now trades near $0.750. A bullish trend line with support at $0.740 on the hourly chart further reinforces the upward momentum. The price also hovers near the 76.4% Fibonacci retracement level from the $0.6700 swing low to the $0.8989 high, providing additional support.
On the upside, key resistance levels are at $0.8450 and $0.8880. A decisive break above $0.900 could trigger further gains, potentially pushing XRP to $0.9250, $0.9550, or even $0.9620 in the near term. The next significant hurdle would be at $0.9850.
Can XRP Maintain Momentum?
If XRP fails to surpass the $0.8450 resistance, a short-term correction might ensue. Immediate support lies at $0.8000, followed by stronger support at $0.7550. A breach below $0.7550 could lead to a retest of the $0.740 support. If the price falls further, the $0.7240 zone will act as critical support to prevent a deeper decline.
Technical Indicators
- Hourly MACD: Bullish, indicating strong upward momentum.
- Hourly RSI: Positioned above 50, confirming bullish sentiment.
Major Support Levels: $0.8000, $0.7550
Major Resistance Levels: $0.8450, $0.8880


